Main objectives of thesis
- Uncertainty about energy savings is a barrier that hinders new renovation projects
- Contribute to lower that barrier
- Promote action to create more energy efficient buildings
Objectives
Agenda
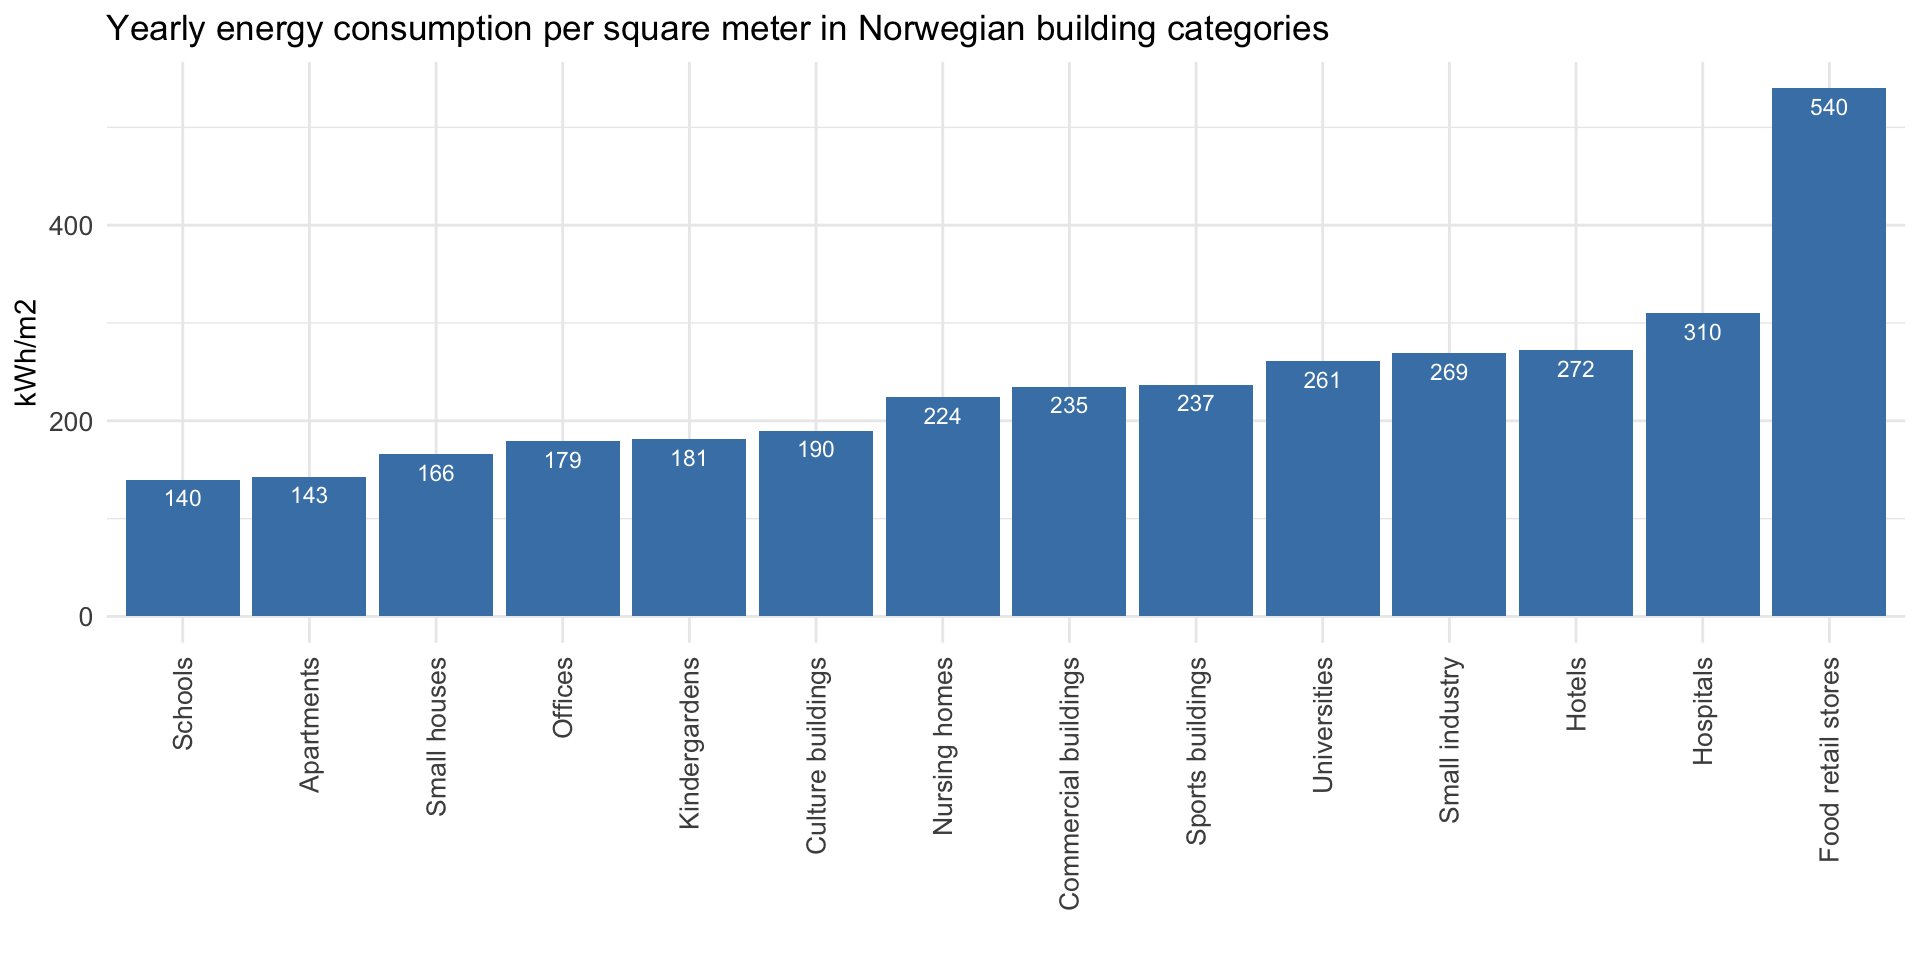
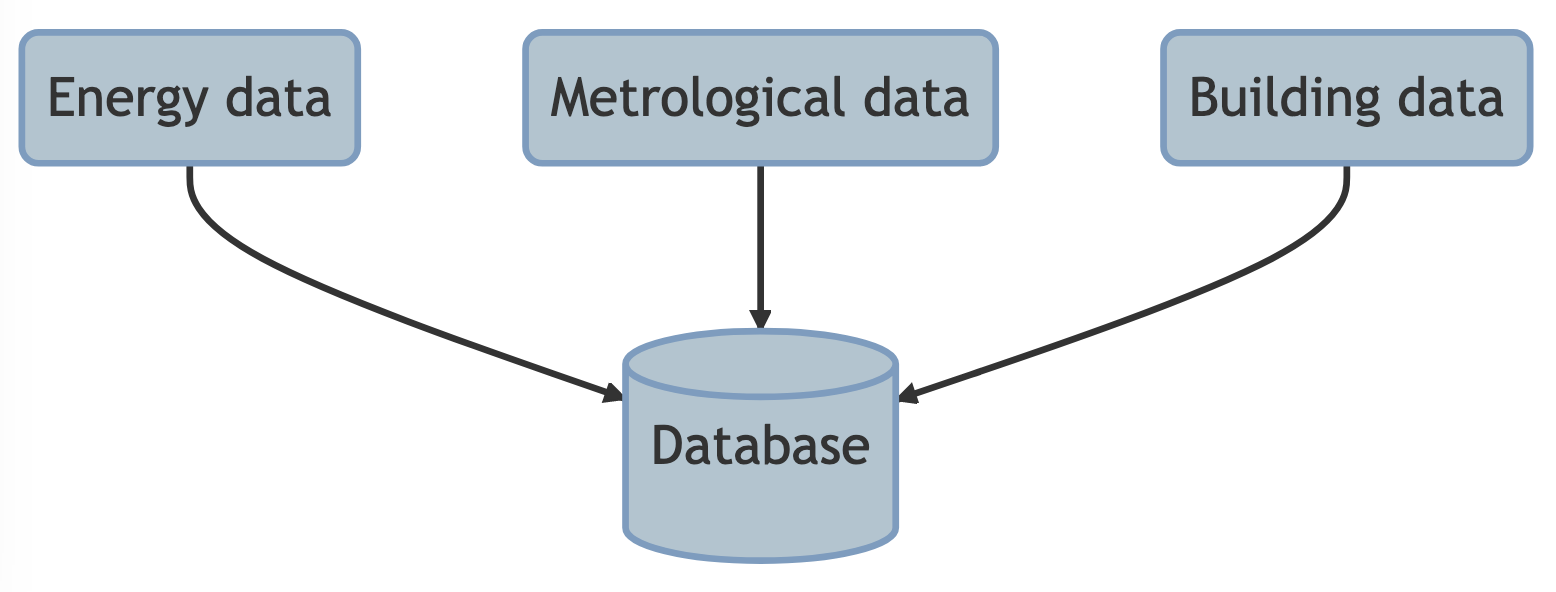
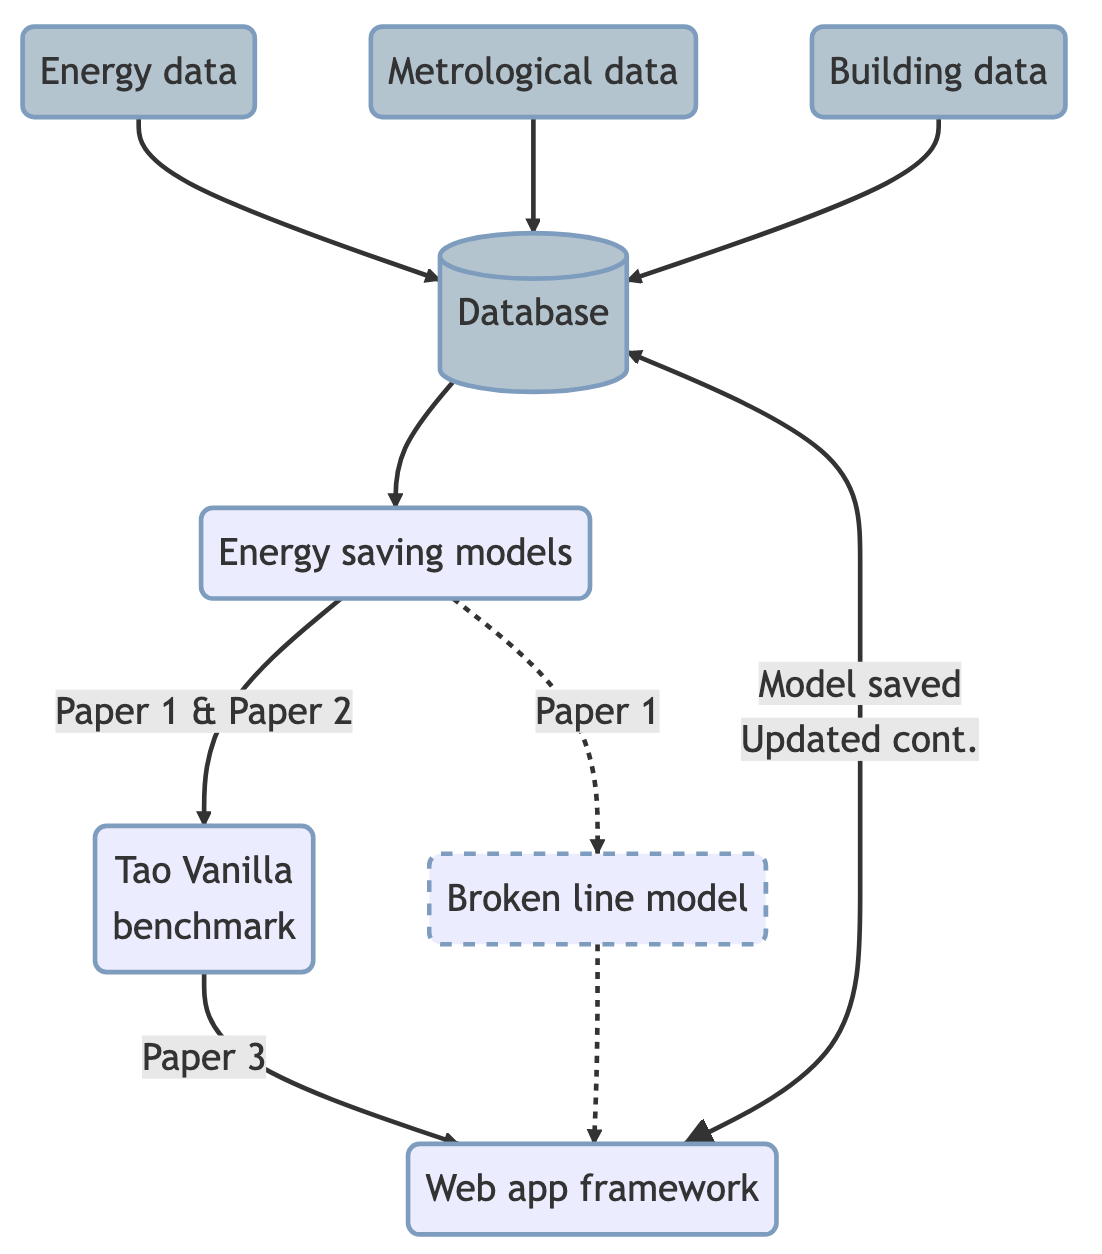
Background
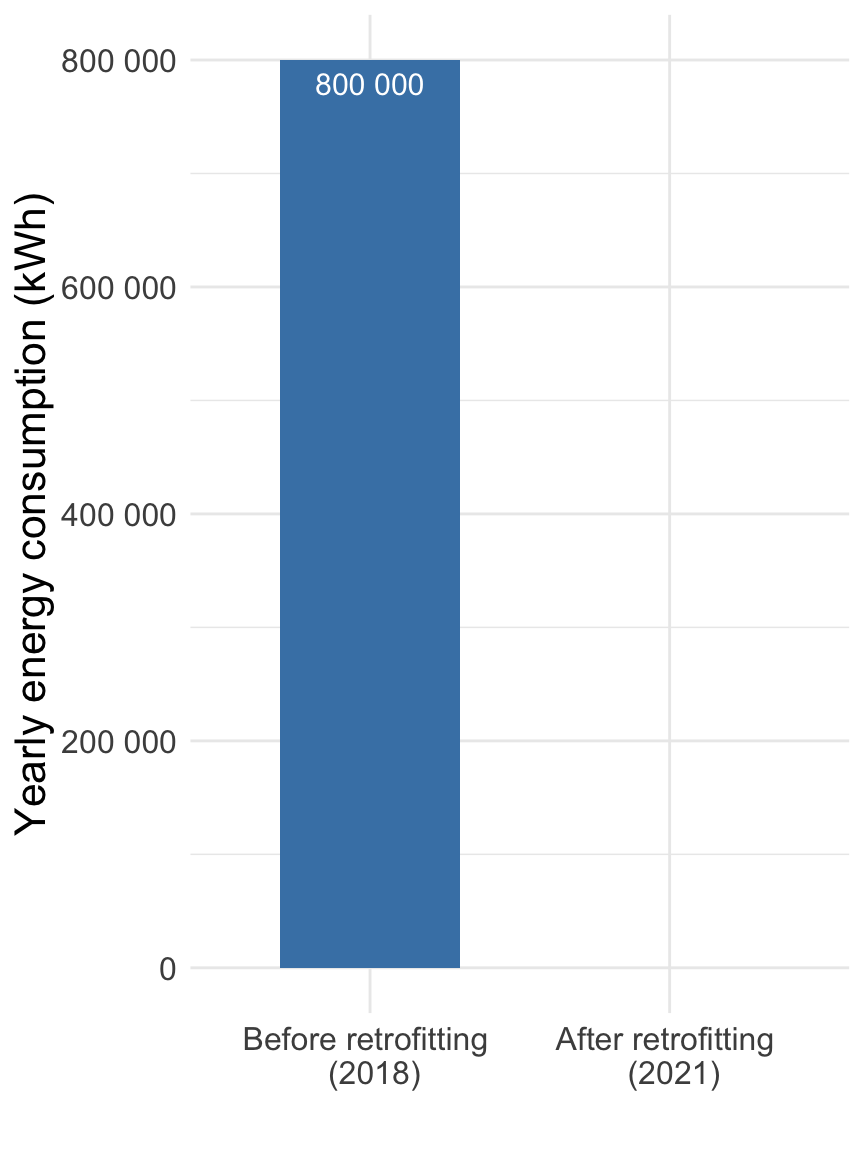
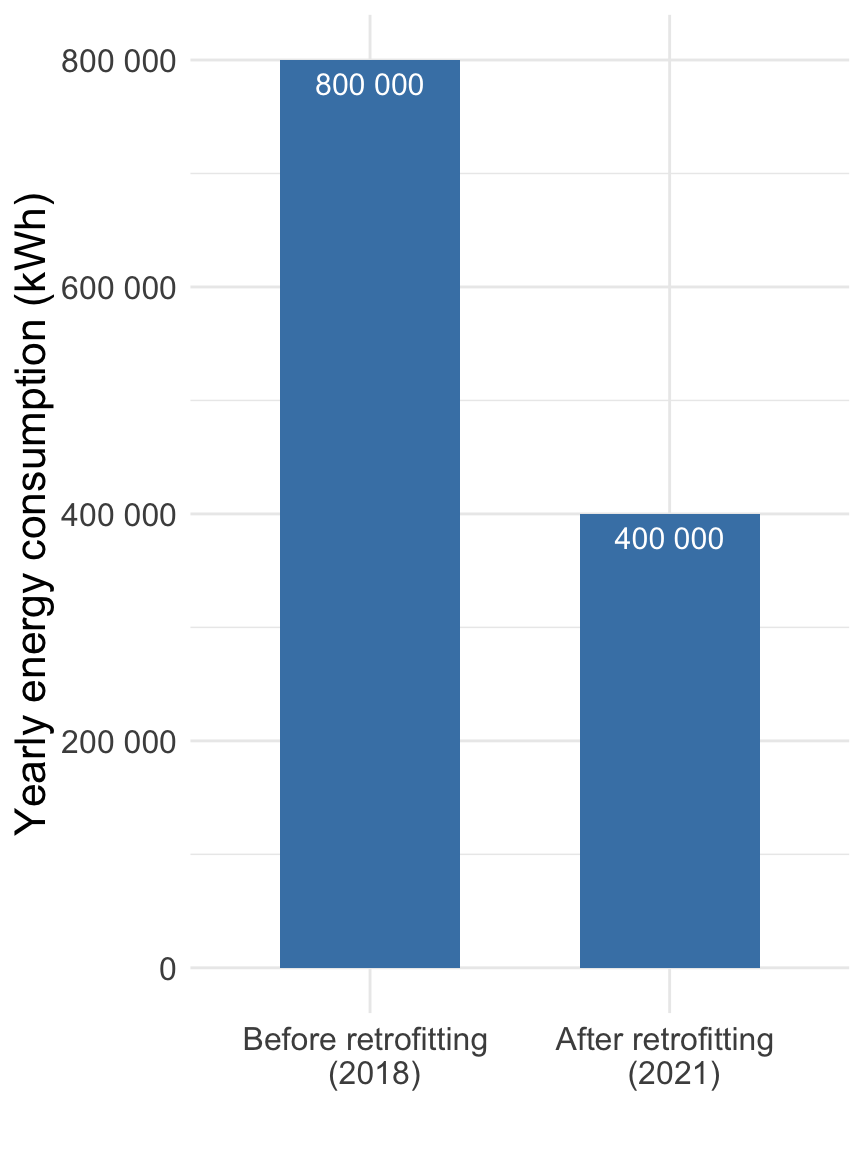
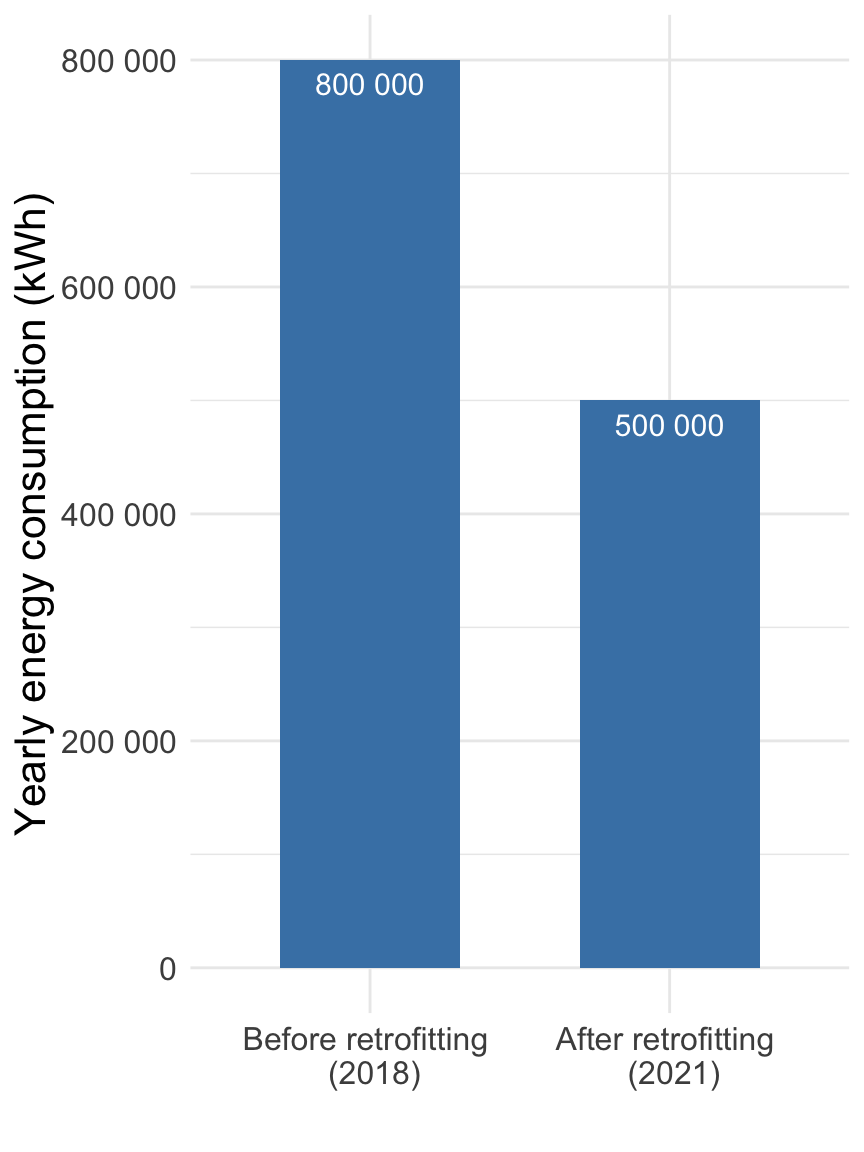
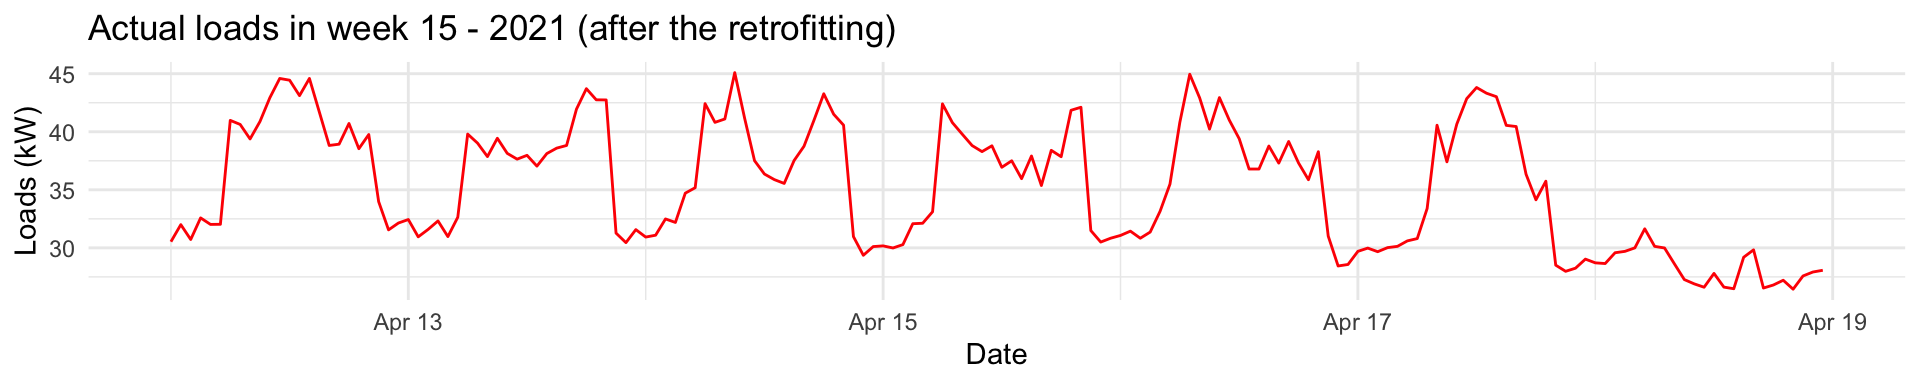
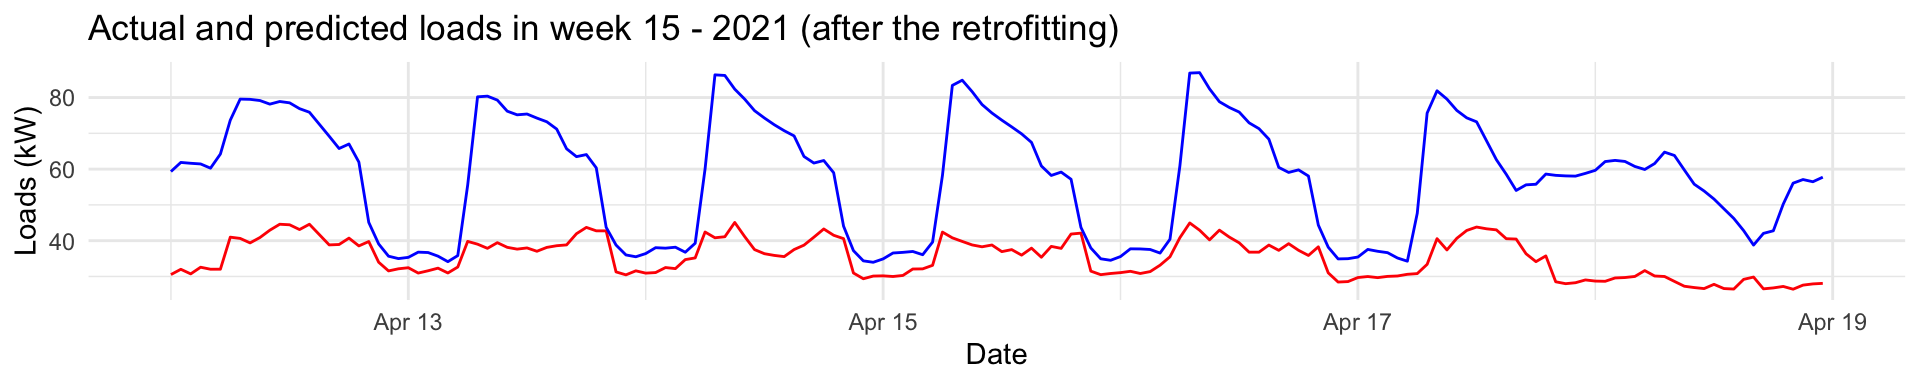
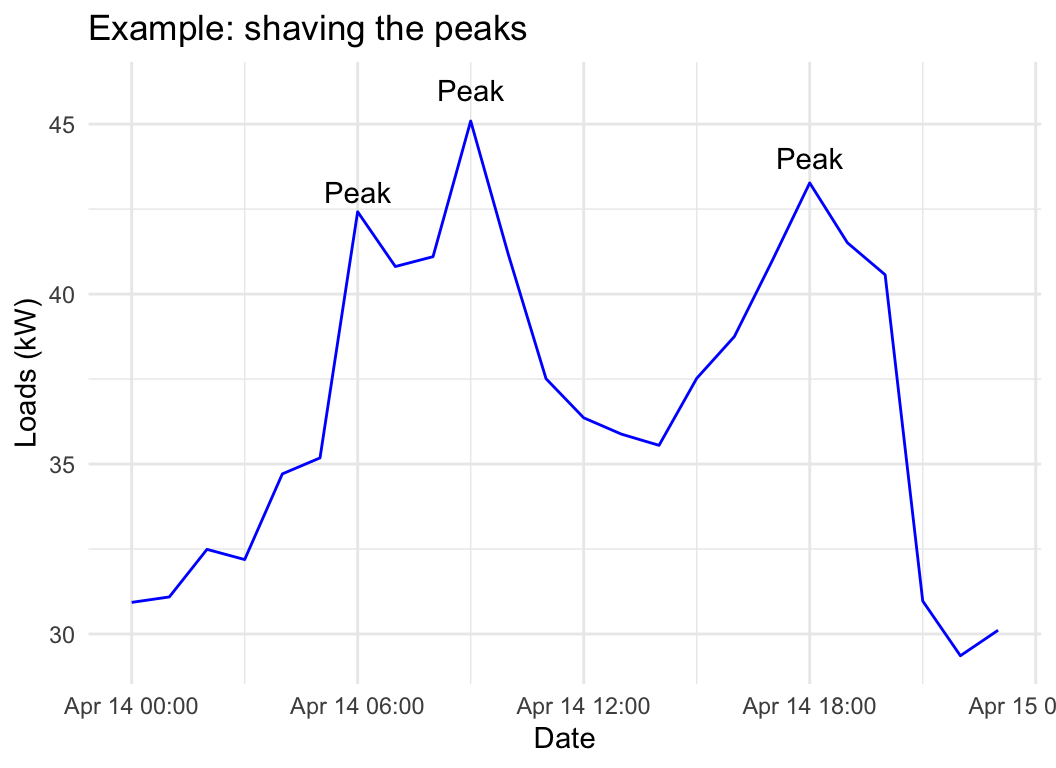
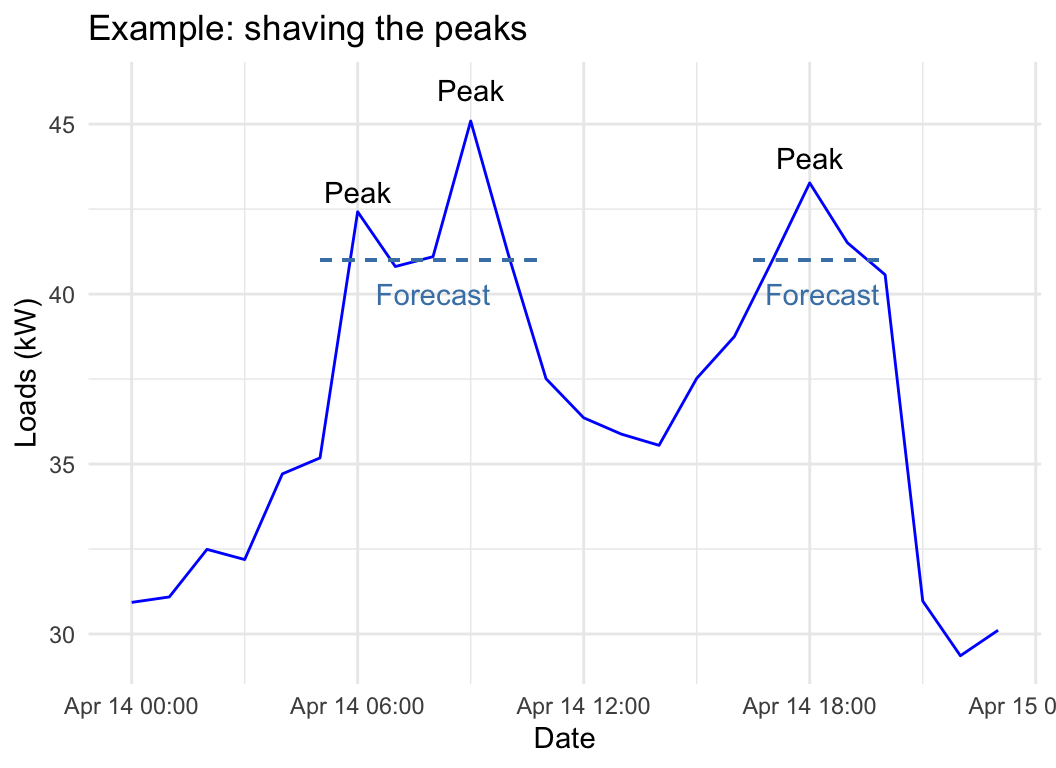
Examples
Paper 1 / 5
Conclusion